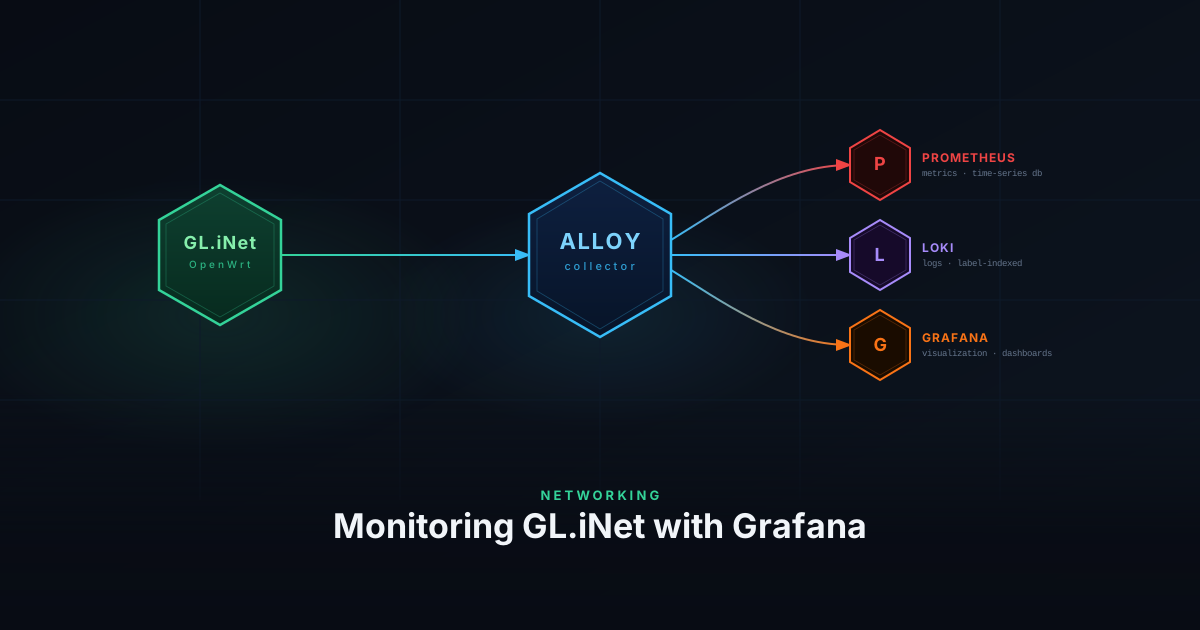
Monitoring GL.iNet with Grafana
Monitor your GL.iNet OpenWRT router with Prometheus node metrics and Grafana Alloy to forward syslog events to Loki for full observability.
4 min
gl-inet
prometheus
loki
alloy
grafana
openwrt

Monitor your GL.iNet OpenWRT router with Prometheus node metrics and Grafana Alloy to forward syslog events to Loki for full observability.
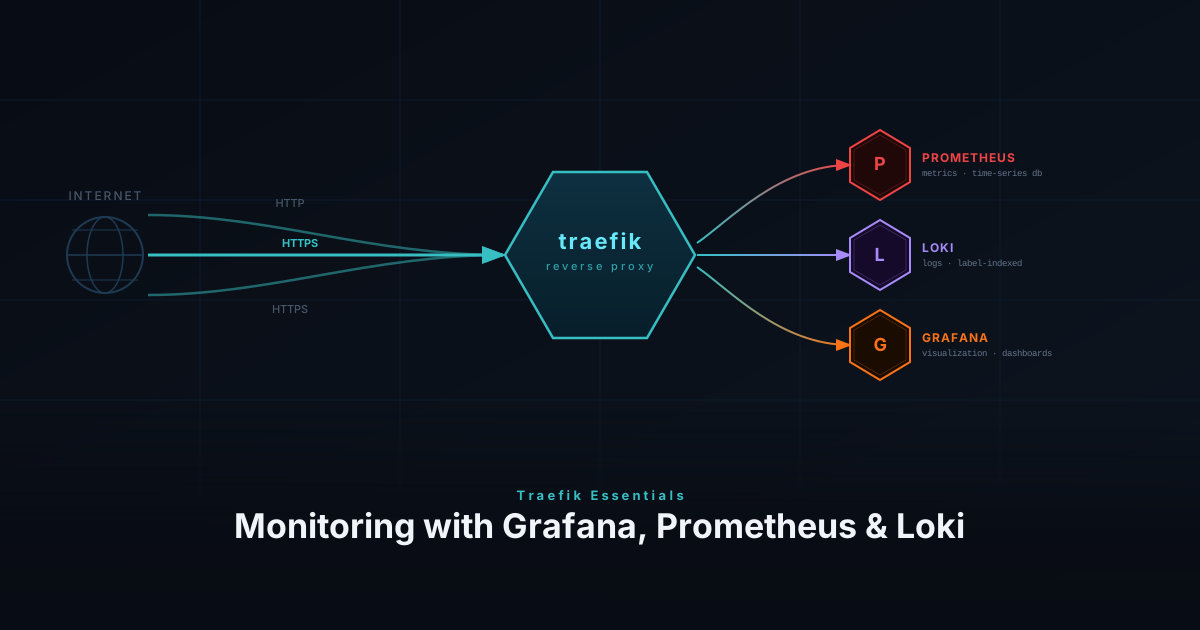
Monitor your Traefik reverse proxy with Prometheus metrics, Loki access logs, and Grafana dashboards for full request-level observability.
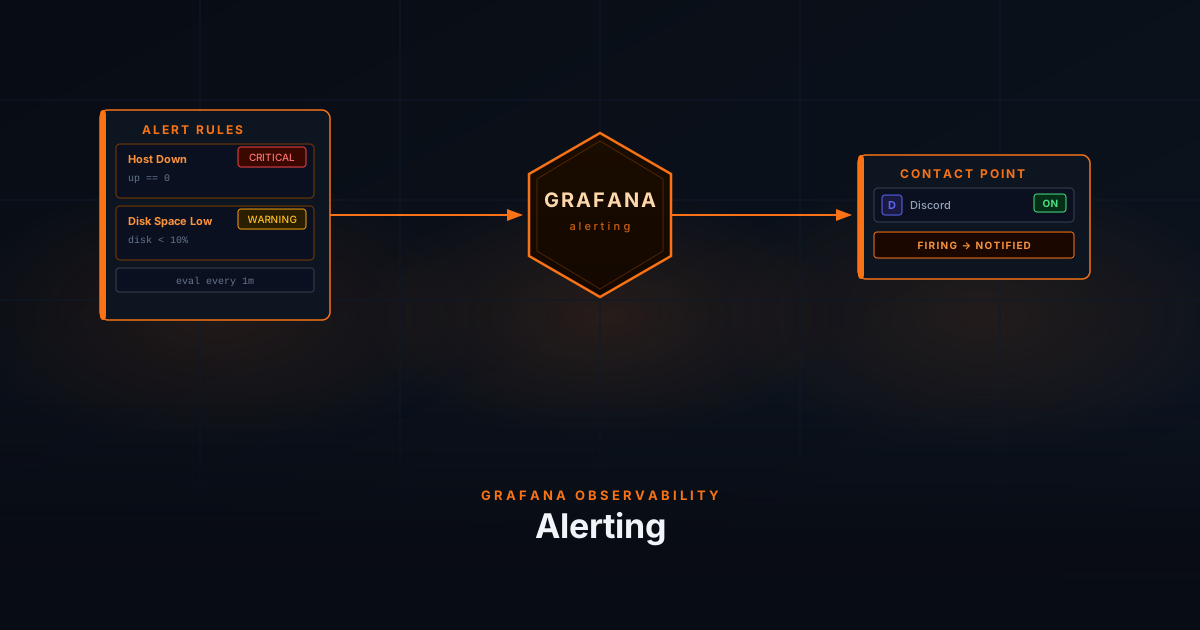
Set up Grafana alert rules against your Prometheus metrics and get notified via Discord when something breaks.
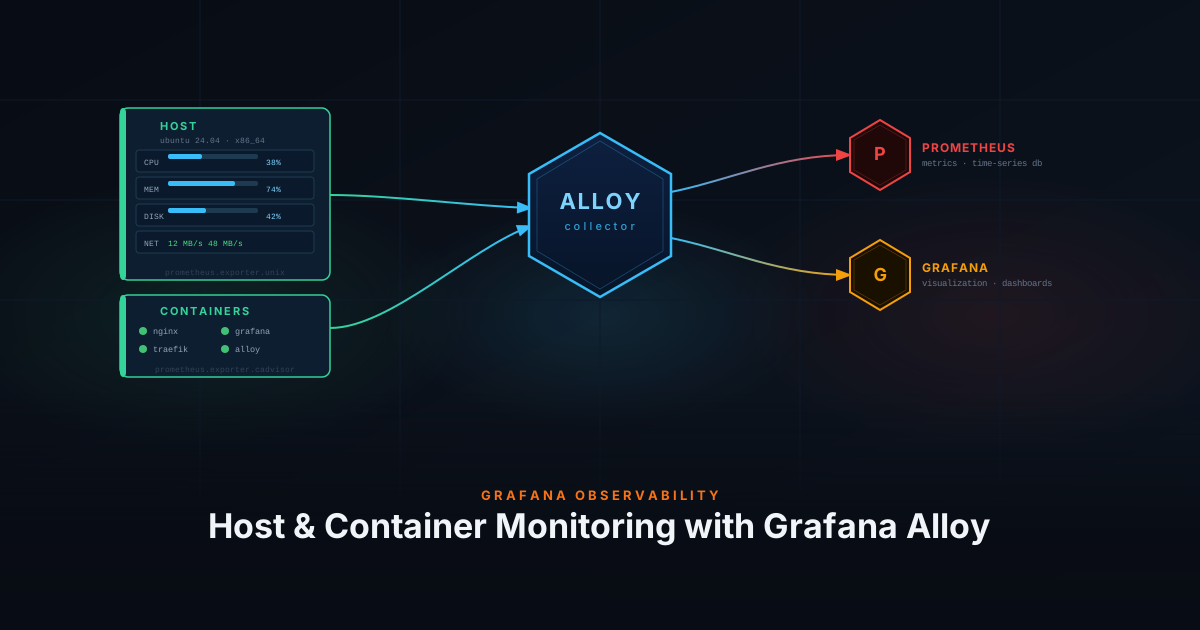
Collect host metrics, Docker container metrics, system logs, and Docker container logs using Grafana Alloy, stored in Prometheus and Loki and visualized in Grafana.
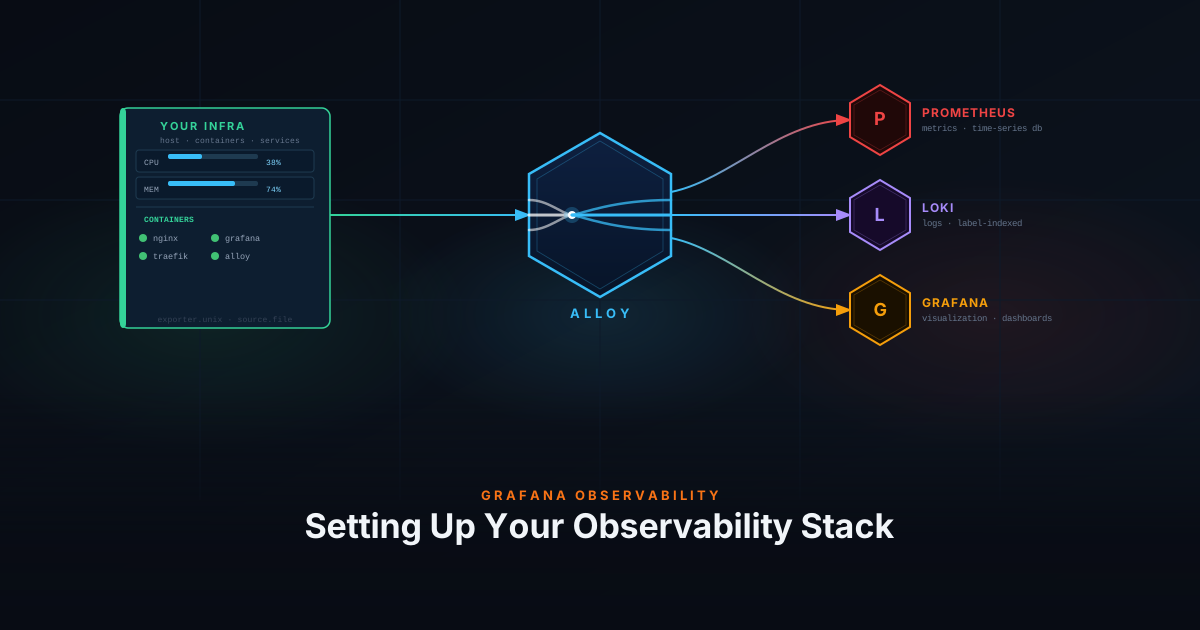
Install Prometheus, Loki, and Grafana with Docker Compose, then deploy Grafana Alloy as a Docker container or a systemd service to build a complete homelab monitoring and observability stack from scratch.
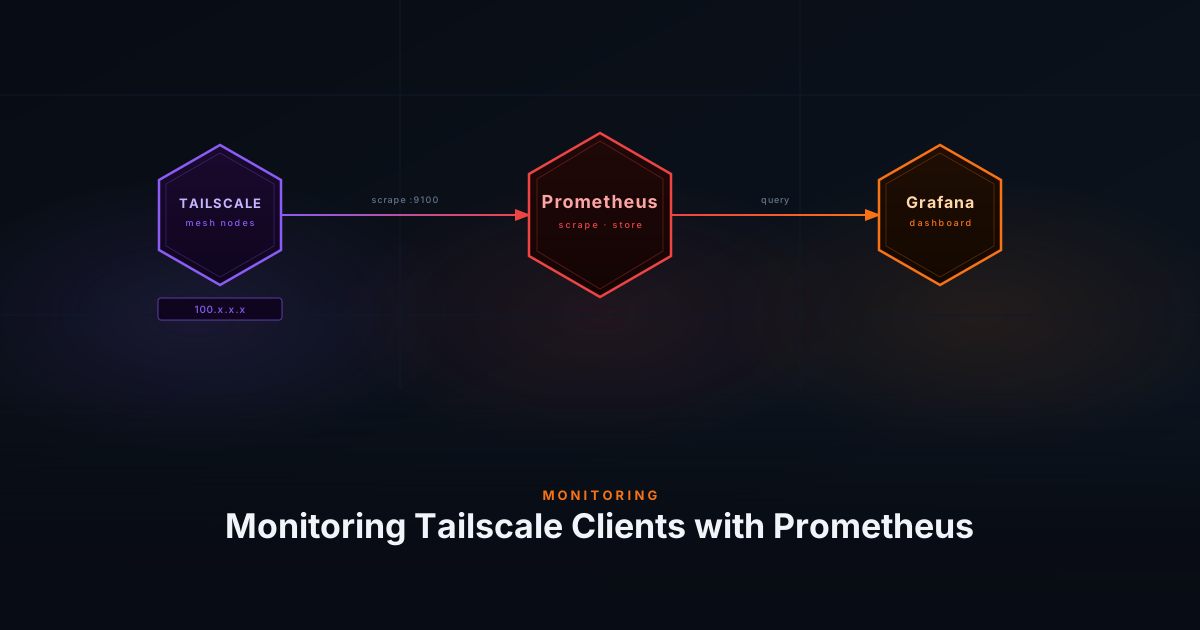
Monitor Tailscale client traffic and connection metrics using Prometheus to gain real-time visibility into your secure overlay network.