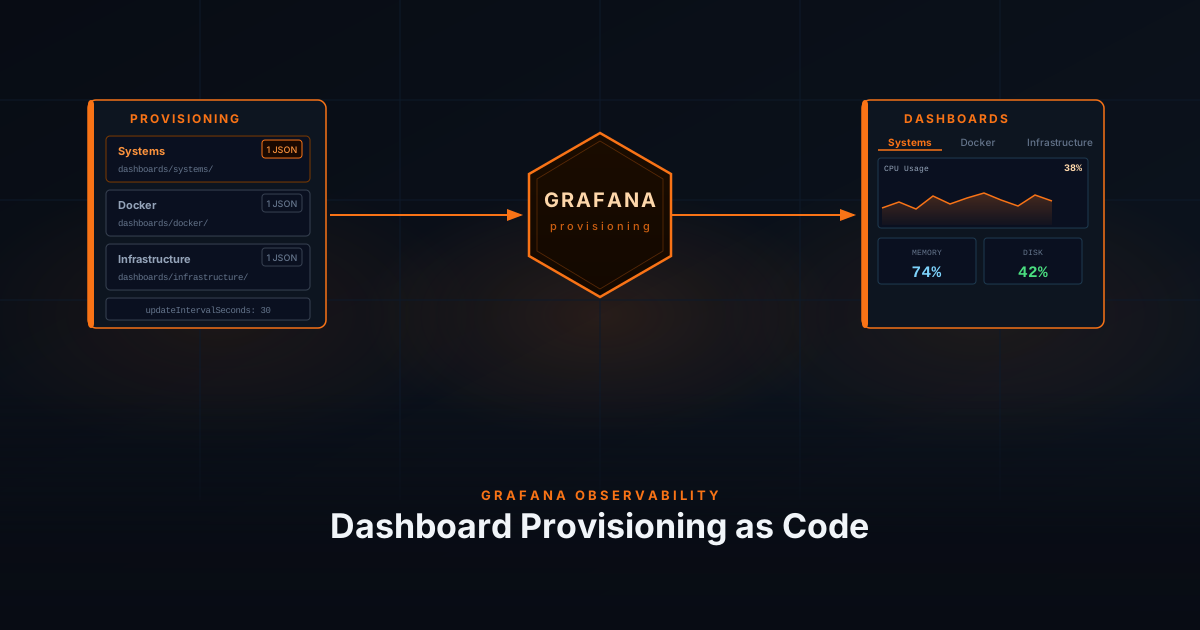
Grafana Observability: Dashboard Provisioning as Code
Store your Grafana dashboards as versioned JSON files that load automatically on startup, so you never lose a dashboard to a container rebuild.
4 min
docker
grafana

A hands-on series for building a production-grade observability stack from scratch. Starting with setting up Grafana, Prometheus, and Loki, then adding Grafana Alloy for metrics and log collection, container and host monitoring, alerting, and dashboards. Follow along in order to end up with a complete, working setup.
Store your Grafana dashboards as versioned JSON files that load automatically on startup, so you never lose a dashboard to a container rebuild.
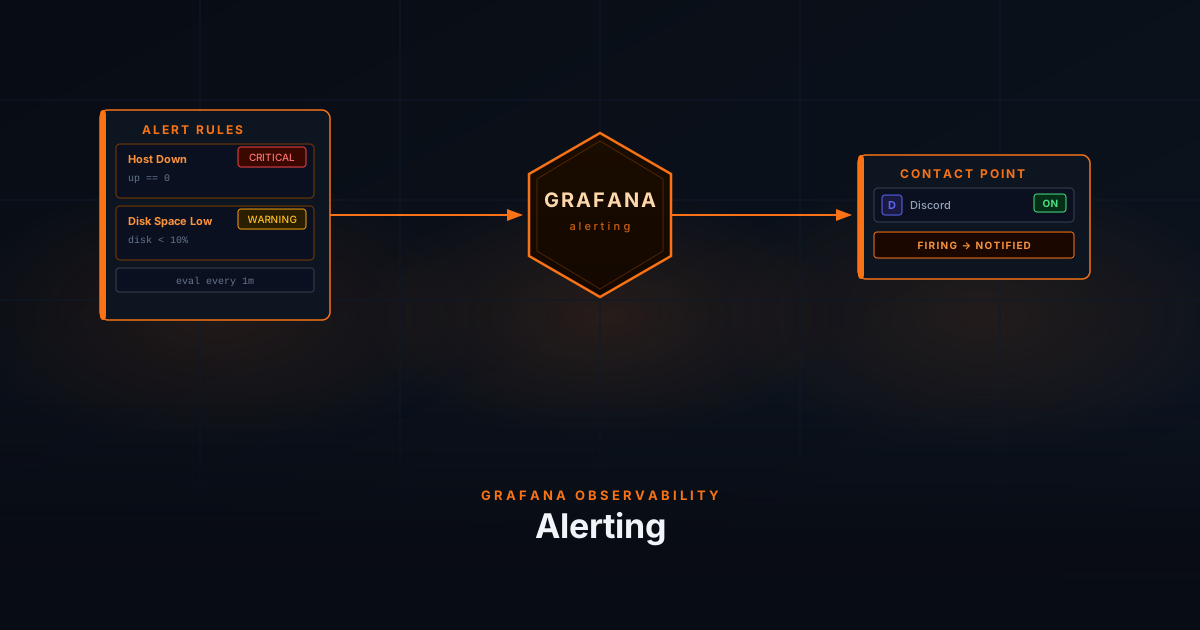
Set up Grafana alert rules against your Prometheus metrics and get notified via Discord when something breaks.
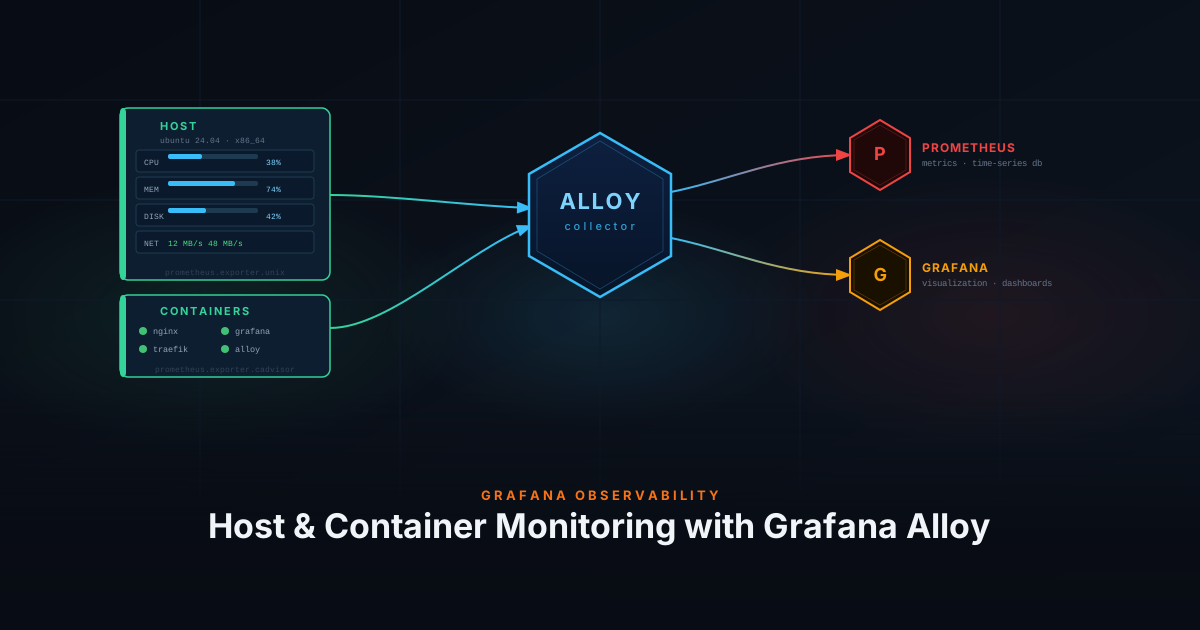
Collect host metrics, Docker container metrics, system logs, and Docker container logs using Grafana Alloy, stored in Prometheus and Loki and visualized in Grafana.
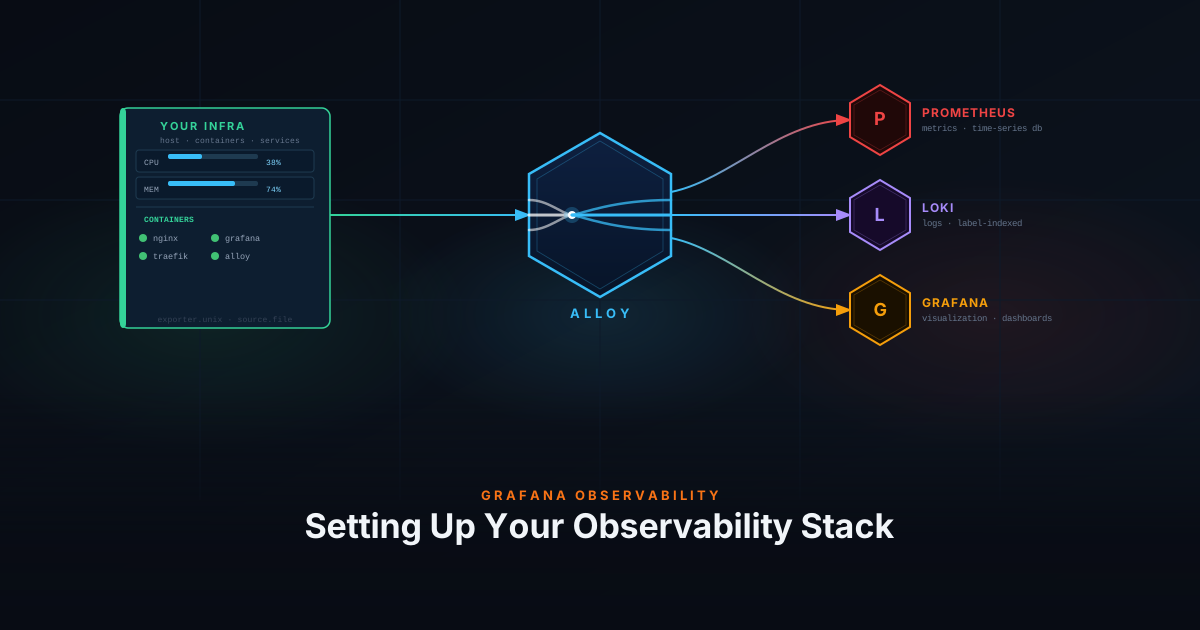
Install Prometheus, Loki, and Grafana with Docker Compose, then deploy Grafana Alloy as a Docker container or a systemd service to build a complete homelab monitoring and observability stack from scratch.