
Prerequisites
- Traefik running — see Installing on Docker & Bare Metal
- Grafana, Prometheus, Loki, and Alloy already running — see Setting Up Your Observability Stack
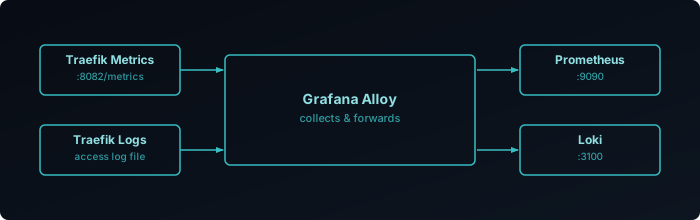
Traefik exposes metrics on EntryPoints, Routers, Services, and more. This post shows you how to collect these metrics with Prometheus and aggregate logs with Loki via Grafana Alloy for a complete monitoring solution.
Metrics
Add the following command flags to your Traefik docker-compose.yml:
command:
  # ... existing commands ...
  - "--metrics.prometheus=true"
  - "--metrics.prometheus.addEntryPointsLabels=true"
  - "--metrics.prometheus.addRoutersLabels=true"
- "--metrics.prometheus.addServicesLabels=true"Re-create the Traefik container to apply the changes:
docker compose -f traefik/docker-compose.yml up -d --force-recreateVerify metrics are available at http://<traefik-ip>:8080/metrics.
Configure Prometheus
Add a scrape job to your prometheus.yml:
scrape_configs:
  - job_name: 'traefik'
    scrape_interval: 5s
    static_configs:
- targets: ['<traefik-ip>:8080']Replace <traefik-ip> with your Traefik server’s IP address, then restart Prometheus:
docker restart prometheusVerify Metrics
Query for Traefik metrics in Grafana’s Explore view:
traefik_router_requests_totalLog Files
Add the following command flags to your Traefik docker-compose.yml:
command:
  # ... existing commands ...
  - "--accesslog=true"
  - "--accesslog.filepath=/log/access.log"
  - "--accesslog.format=json"
  - "--accesslog.fields.defaultmode=keep"
  - "--accesslog.fields.names.StartUTC=drop"
  - "--log.filepath=/log/traefik.log"
- "--log.format=json"Setting a
filepathredirects logs to a file — they will no longer appear indocker logs.
Also add a volume mapping for the log directory:
volumes:
  # ... existing volumes ...
- /var/log/traefik:/logRe-create the Traefik container:
docker compose -f traefik/docker-compose.yml up -d --force-recreateConfigure Grafana Alloy
Create a new Alloy config file for Traefik log collection:
nano alloy/config/traefik.alloy// Traefik logs collection
local.file_match "traefik" {
path_targets = [{
__path__ = "/var/log/traefik/*.log",
}]
}
loki.source.file "traefik" {
targets = local.file_match.traefik.targets
forward_to = [loki.process.traefik.receiver]
}
loki.process "traefik" {
stage.static_labels {
values = {
job = "traefik",
}
}
forward_to = [loki.write.default.receiver]
}Ensure your Alloy docker-compose.yml has /var/log mounted:
volumes:
  - ./config/:/etc/alloy/config/:ro
  - /var/log:/var/log:ro
- alloy-data:/var/lib/alloy/dataRestart Alloy to pick up the new configuration:
docker restart alloyVerify Logs
Open the Alloy Web UI and confirm the loki.source.file component is healthy, then query in Grafana:
{job="traefik"}Grafana Dashboard
You can use the pre-built Traefik Dashboard from GitHub, or explore available metrics from the official Traefik metrics overview .