
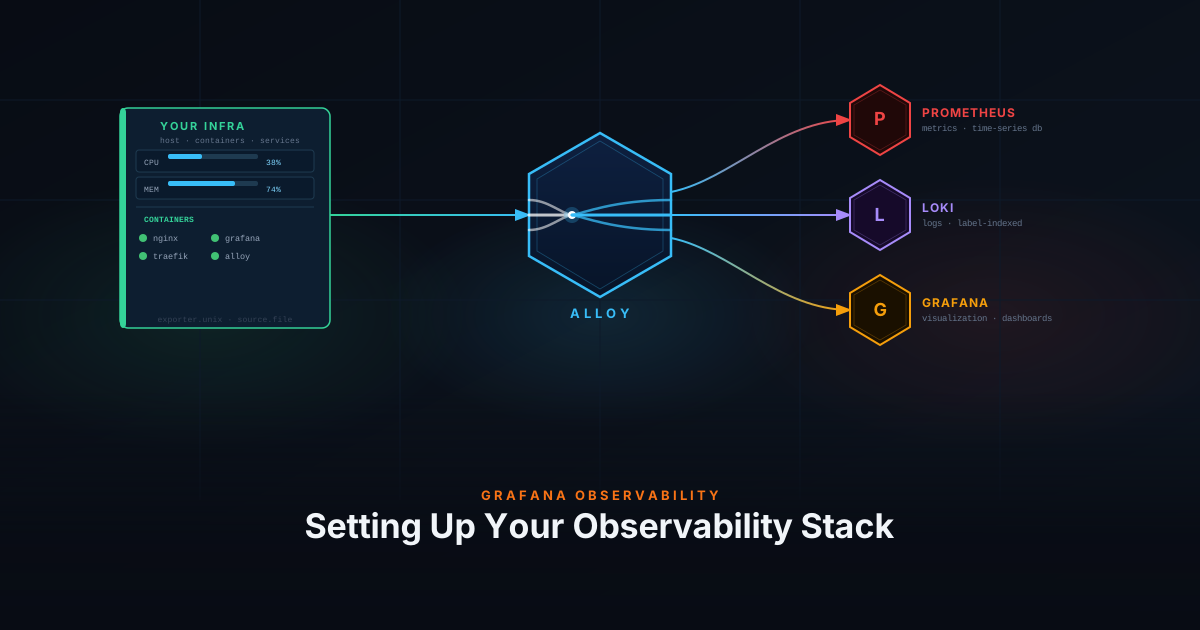
Before you can collect metrics or centralize logs, you need somewhere to store and visualize them — and an agent to collect the data. This post sets up all four components of a Grafana observability stack:
- Prometheus — metrics storage
- Loki — log storage
- Grafana — visualization
- Grafana Alloy — telemetry collection agent
Prometheus
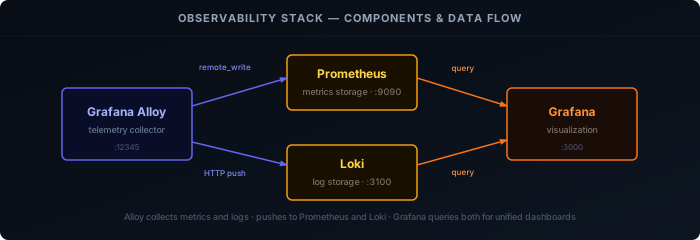
Prometheus is a time-series database that stores metrics. We’ll enable the remote write receiver so Alloy can push metrics directly to it.
Create a directory and Docker Compose file:
mkdir prometheus
nano prometheus/docker-compose.ymlservices:
prometheus:
image: prom/prometheus
container_name: prometheus
environment:
- TZ=Europe/Amsterdam
volumes:
- ./prometheus.yml:/etc/prometheus/prometheus.yml:ro
- prometheus:/prometheus
command:
- '--config.file=/etc/prometheus/prometheus.yml'
- '--storage.tsdb.path=/prometheus'
- '--storage.tsdb.retention.time=90d'
- '--storage.tsdb.retention.size=100GB'
- '--web.enable-lifecycle'
- '--web.enable-remote-write-receiver'
restart: unless-stopped
networks:
- backend
networks:
backend:
name: backend
volumes:
prometheus:
name: prometheusCreate the Prometheus config file:
nano prometheus/prometheus.ymlglobal:
scrape_interval: 15s
evaluation_interval: 15s
scrape_configs: []scrape_configs is empty because Alloy pushes metrics via remote write. Adjust retention.time and retention.size to match your available disk space — whichever limit is hit first triggers cleanup.
Start Prometheus:
docker compose -f prometheus/docker-compose.yml up -dVerify it’s ready:
curl -s http://localhost:9090/-/readyLoki
Loki stores logs indexed by labels rather than full-text, making it storage-efficient and fast for label-based queries.
Create a directory and Docker Compose file:
mkdir loki
nano loki/docker-compose.ymlservices:
loki:
image: grafana/loki
container_name: loki
restart: unless-stopped
environment:
- TZ=Europe/Amsterdam
volumes:
- ./loki-config.yaml:/etc/loki/loki-config.yaml:ro
- loki-data:/loki
command: -config.file=/etc/loki/loki-config.yaml
networks:
- backend
networks:
backend:
name: backend
volumes:
loki-data:
name: loki-dataCreate the Loki config file:
nano loki/loki-config.yamlauth_enabled: false
server:
http_listen_address: 0.0.0.0
http_listen_port: 3100
grpc_listen_port: 9095
log_level: info
common:
instance_addr: 127.0.0.1
path_prefix: /loki
storage:
filesystem:
chunks_directory: /loki/chunks
rules_directory: /loki/rules
replication_factor: 1
ring:
kvstore:
store: memberlist
schema_config:
configs:
- from: 2020-10-24
store: tsdb
object_store: filesystem
schema: v13
index:
prefix: index_
period: 24h
limits_config:
query_timeout: 600s
retention_period: "365d"
ingestion_rate_mb: 4
ingestion_burst_size_mb: 6
max_streams_per_user: 10000
max_line_size: 256000
reject_old_samples: true
reject_old_samples_max_age: 168h
creation_grace_period: 15m
discover_log_levels: falseAdjust retention_period based on your available disk space.
Start Loki:
docker compose -f loki/docker-compose.yml up -dVerify it’s ready:
curl -s http://localhost:3100/readyGrafana
Grafana is the visualization layer — it connects to Prometheus and Loki and lets you build dashboards and explore data.
Create a directory and Docker Compose file:
mkdir grafana
nano grafana/docker-compose.ymlservices:
grafana:
image: grafana/grafana
container_name: grafana
hostname: ${HOSTNAME}
environment:
- TZ=Europe/Amsterdam
- GF_SECURITY_ADMIN_PASSWORD=admin
volumes:
- grafana_data:/var/lib/grafana
restart: unless-stopped
ports:
- 3000:3000
networks:
- backend
networks:
backend:
name: backend
volumes:
grafana_data:
name: grafana_dataChange GF_SECURITY_ADMIN_PASSWORD to a secure password before starting.
Start Grafana:
docker compose -f grafana/docker-compose.yml up -dOpen http://<HOST_IP>:3000 and log in with username admin and your password.
Add Datasources
Connect Grafana to Prometheus and Loki:
Prometheus:
- Click Connections → search for Prometheus → Add new Datasource
- Set name
prometheus, URLhttp://prometheus:9090 - Click Save & Test
Loki:
- Click Connections → search for Loki → Add new Datasource
- Set name
loki, URLhttp://loki:3100 - Click Save & Test
Grafana Alloy
Alloy is the telemetry collection agent that replaces Promtail and Grafana Agent. It collects metrics, logs, and traces and forwards them to Prometheus and Loki using a modular config — each collector lives in its own .alloy file, and every file in the config directory is loaded automatically.
You can run Alloy two ways, and both are covered below:
- Docker — simplest if the rest of your stack is already containerized on the same host
- systemd — installs Alloy directly on the host, giving it native access to resources like
/var/logor the Docker socket without volume mounts, and lets it start earlier in the boot sequence than Docker itself
Alloy (Docker)
Create a directory for Alloy and its config files:
mkdir -p alloy/config
nano alloy/docker-compose.ymlservices:
alloy:
image: grafana/alloy:latest
container_name: alloy
hostname: ${HOSTNAME}
restart: unless-stopped
environment:
- TZ=Europe/Amsterdam
ports:
- "12345:12345"
volumes:
- ./config/:/etc/alloy/config/:ro
- alloy-data:/var/lib/alloy/data
command:
- run
- --server.http.listen-addr=0.0.0.0:12345
- --storage.path=/var/lib/alloy/data
- /etc/alloy/config/
networks:
- backend
networks:
backend:
name: backend
volumes:
alloy-data:
name: alloy-dataAlloy loads every .alloy file in the config/ directory automatically — adding a new collector is as simple as dropping in a new file. Port 12345 is the Alloy web UI for debugging component status.
Endpoints
Create endpoint.alloy to centralize write destinations. All collector configs reference these by name:
nano alloy/config/endpoint.alloyloki.write "default" {
endpoint {
url = "http://loki:3100/loki/api/v1/push"
}
}
prometheus.remote_write "default" {
endpoint {
url = "http://prometheus:9090/api/v1/write"
}
}Self-Monitoring
Create self.alloy so Alloy reports its own health metrics to Prometheus:
nano alloy/config/self.alloyprometheus.exporter.self "alloy_metrics" {}
prometheus.scrape "alloy_metrics" {
targets = prometheus.exporter.self.alloy_metrics.targets
scrape_interval = "60s"
forward_to = [prometheus.remote_write.default.receiver]
}Start Alloy:
docker compose -f alloy/docker-compose.yml up -dOpen the Alloy web UI at http://<HOST_IP>:12345 to verify all components are green.
Alloy (systemd)
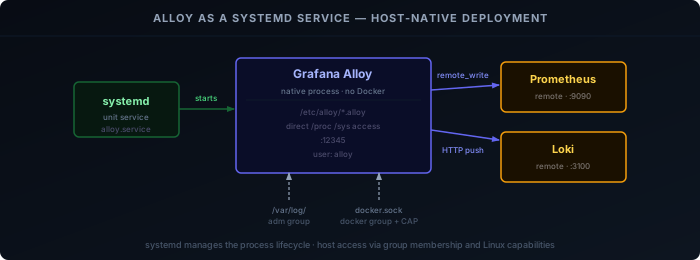
Running Alloy as a systemd service is an alternative to the Docker container above — useful when you want the agent to have direct access to the host filesystem without volume mounts, or to have it start earlier in the boot process than Docker.
Install
Add the Grafana apt repository and install the alloy package:
sudo apt-get install -y apt-transport-https software-properties-common wget

sudo mkdir -p /etc/apt/keyrings/
wget -q -O - https://apt.grafana.com/gpg.key | gpg --dearmor | sudo tee /etc/apt/keyrings/grafana.gpg > /dev/null

echo "deb [signed-by=/etc/apt/keyrings/grafana.gpg] https://apt.grafana.com stable main" | \
  sudo tee /etc/apt/sources.list.d/grafana.list

sudo apt-get update
sudo apt-get install -y alloyThe package creates an alloy system user, installs the binary at /usr/bin/alloy, and registers a systemd unit. It does not start automatically after install.
Configure
The systemd unit reads startup options from /etc/default/alloy. Edit it to load a config directory instead of a single file — the same pattern used in the Docker setup:
sudo nano /etc/default/alloyCONFIG_FILE="/etc/alloy/config/"
CUSTOM_ARGS="--server.http.listen-addr=0.0.0.0:12345"
STATE_DIRECTORY="/var/lib/alloy"By default Alloy only listens on localhost:12345, so CUSTOM_ARGS is used here to expose the web UI on all interfaces. This is optional.
Create the config directory:
sudo mkdir -p /etc/alloy/configThe endpoint.alloy and self.alloy files are the same config as the Docker path above — copy them into /etc/alloy/config/. The one difference: since the systemd service isn’t on the Docker backend network, replace the loki and prometheus hostnames in endpoint.alloy with the actual IP or hostname of your Prometheus and Loki instances, e.g. http://<HOST>:3100/loki/api/v1/push and http://<HOST>:9090/api/v1/write.
Fix permissions so the config files are readable by the alloy user:
sudo chown -R alloy:alloy /etc/alloy/config
sudo chmod -R 750 /etc/alloy/configPermissions
The alloy user only has access to its own files by default. If you plan to collect system logs or Docker container stats and logs, you need to grant it read access to those resources.
System logs (/var/log):
sudo usermod -aG adm alloyDocker container logs and stats:
Adding the alloy user to the docker group is not enough — Docker’s cgroup files and log directories are owned by root and require CAP_DAC_READ_SEARCH to traverse. Create a systemd drop-in to grant that capability:
sudo mkdir -p /etc/systemd/system/alloy.service.d
sudo tee /etc/systemd/system/alloy.service.d/capabilities.conf <<'EOF'
[Service]
AmbientCapabilities=CAP_DAC_READ_SEARCH
CapabilityBoundingSet=CAP_DAC_READ_SEARCH
EOF
sudo systemctl daemon-reload
sudo usermod -aG docker alloyA service restart is required after any permission change.
Start
Enable and start the service:
sudo systemctl enable alloy
sudo systemctl start alloyCheck that it came up cleanly:
sudo systemctl status alloyYou should see active (running). If it failed, check the journal:
sudo journalctl -u alloy -n 50Verify
Confirm Alloy is healthy and listening:
curl -s http://localhost:12345/-/healthyOpen the Alloy web UI at http://<HOST_IP>:12345 and verify all components show green. The prometheus.remote_write.default and loki.write.default components should both be running.
What’s Next
With the full stack running — whether Alloy is deployed as a Docker container or a systemd service — start adding collectors:
- Host, Container & Log Monitoring — CPU, memory, disk, and Docker container metrics, plus system and container logs
Alloy loads every .alloy file it finds in its config directory automatically, so adding a new collector is just a matter of dropping in a new file and reloading: docker restart alloy for the Docker deployment, or sudo systemctl reload alloy for systemd.