
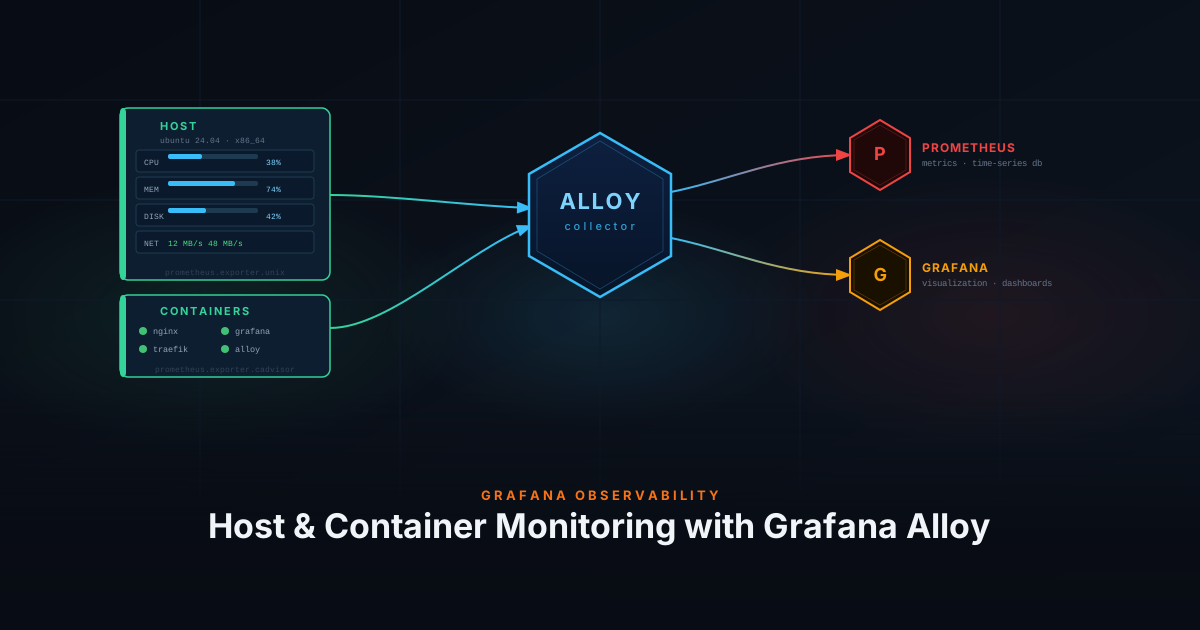
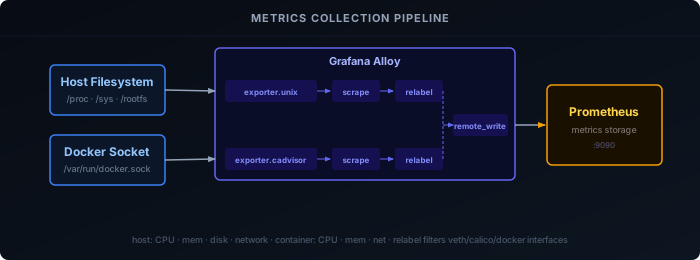
Monitoring your systems and containers is essential for maintaining a reliable homelab or home server — but metrics are only half the picture. This guide uses Grafana Alloy’s built-in exporters and log collectors to gather host metrics, Docker container metrics, system logs, and Docker container logs, all through a single agent instead of separate containers per exporter. Metrics land in Prometheus, logs land in Loki, and both are visualized in Grafana.
Prerequisites
- Prometheus running and reachable
- Loki running and reachable
- Grafana running with Prometheus and Loki added as datasources
- Grafana Alloy installed and running — see Setting Up Your Observability Stack
Host Metrics
Create an Alloy config file for host system metrics:
nano alloy/config/unix.alloyprometheus.exporter.unix "unix" {
rootfs_path = "/rootfs"
procfs_path = "/rootfs/proc"
sysfs_path = "/rootfs/sys"
disable_collectors = ["ipvs", "btrfs", "infiniband", "xfs", "zfs"]
enable_collectors = ["meminfo", "processes"]
filesystem {
fs_types_exclude = "^(autofs|binfmt_misc|bpf|cgroup2?|configfs|debugfs|devpts|devtmpfs|tmpfs|fusectl|hugetlbfs|iso9660|mqueue|nsfs|overlay|proc|procfs|pstore|rpc_pipefs|securityfs|selinuxfs|squashfs|sysfs|tracefs)$"
mount_points_exclude = "^/(dev|proc|run/credentials/.+|sys|var/lib/docker/.+)($|/)"
mount_timeout = "5s"
}
netclass {
ignored_devices = "^(veth.*|cali.*|[a-f0-9]{15})$"
}
netdev {
device_exclude = "^(veth.*|cali.*|[a-f0-9]{15})$"
}
}
prometheus.scrape "unix" {
targets = prometheus.exporter.unix.unix.targets
forward_to = [prometheus.remote_write.default.receiver]
}Because Alloy runs inside Docker with the host filesystem bind-mounted at /rootfs, the rootfs_path, procfs_path, and sysfs_path fields tell the exporter where to find real system data rather than the container’s own filesystem.
disable_collectors turns off collectors you are unlikely to need on a typical Linux homelab (IPVS load balancer, Btrfs, InfiniBand). enable_collectors adds meminfo and processes, which are not enabled by default.
The filesystem block excludes virtual filesystem types (tmpfs, cgroup, overlay, etc.) and Docker-internal mount points so only real disks appear in Grafana. mount_timeout prevents the scrape from hanging if a network mount is unresponsive.
Both netclass and netdev use the same pattern to ignore virtual Ethernet interfaces created by Docker and Calico, as well as the 15-character hex interface names Kubernetes generates — keeping the network panels focused on real physical or VLAN interfaces.
This exporter needs the host filesystem mounted read-only into the Alloy container — see Apply & Verify below for the required volume mounts.
Container Metrics
Create an Alloy config file for Docker container metrics:
nano alloy/config/docker-metrics.alloy// Docker container metrics (CPU, memory, network per container)
prometheus.exporter.cadvisor "dockermetrics" {
docker_host = "unix:///var/run/docker.sock"
storage_duration = "5m"
}
prometheus.relabel "docker_filter" {
forward_to = [prometheus.remote_write.default.receiver]
rule {
target_label = "job"
replacement = "docker"
}
rule {
target_label = "instance"
replacement = constants.hostname
}
// Drop container_spec metrics that frequently contain NaN values
rule {
source_labels = ["__name__"]
regex = "container_spec_(cpu_period|cpu_quota|cpu_shares|memory_limit_bytes|memory_swap_limit_bytes|memory_reservation_limit_bytes)"
action = "drop"
}
}
prometheus.scrape "dockermetrics" {
targets = prometheus.exporter.cadvisor.dockermetrics.targets
forward_to = [prometheus.relabel.docker_filter.receiver]
scrape_interval = "10s"
}This exporter needs the Docker socket mounted into the Alloy container — see Apply & Verify below.
System Logs
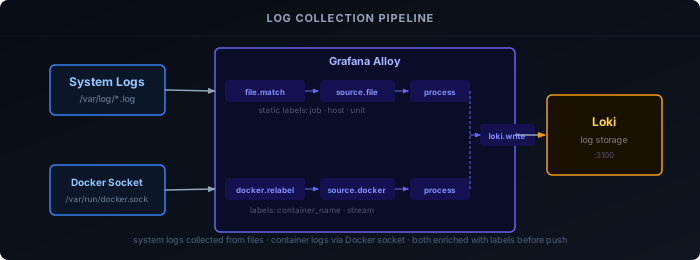
Centralized logging complements metrics by letting you search and correlate events across your infrastructure. Create an Alloy config file to collect auth.log and syslog from the host:
nano alloy/config/syslog.alloy// System auth.log collection
local.file_match "authlog" {
path_targets = [{
__path__ = "/var/log/auth.log",
}]
}
loki.source.file "authlog" {
targets = local.file_match.authlog.targets
forward_to = [loki.process.authlog.receiver]
}
loki.process "authlog" {
stage.static_labels {
values = {
job = "authlog",
}
}
forward_to = [loki.write.default.receiver]
}
// System syslog collection
local.file_match "syslog" {
path_targets = [{
__path__ = "/var/log/syslog",
}]
}
loki.source.file "syslog" {
targets = local.file_match.syslog.targets
forward_to = [loki.process.syslog.receiver]
}
loki.process "syslog" {
stage.static_labels {
values = {
job = "syslog",
}
}
forward_to = [loki.write.default.receiver]
}The path_targets field supports wildcards — you can use /var/log/*.log to collect all log files in a directory at once.
This collector needs the host’s /var/log directory mounted into the Alloy container — see Apply & Verify below.
Docker Container Logs
Alloy can automatically discover and collect logs from all running Docker containers — no manual configuration needed per container.
Create an Alloy config file for Docker log collection:
nano alloy/config/docker-logs.alloy// Discover all running Docker containers
discovery.docker "containers" {
host = "unix:///var/run/docker.sock"
}
// Extract useful labels from container metadata
discovery.relabel "containers" {
targets = discovery.docker.containers.targets
rule {
source_labels = ["__meta_docker_container_name"]
target_label = "container"
regex = "/(.*)"
replacement = "$1"
}
rule {
source_labels = ["__meta_docker_container_log_stream"]
target_label = "stream"
}
}
// Collect logs from discovered containers
loki.source.docker "containers" {
host = "unix:///var/run/docker.sock"
targets = discovery.relabel.containers.output
forward_to = [loki.process.containers.receiver]
}
// Add a static job label and forward to Loki
loki.process "containers" {
stage.static_labels {
values = {
job = "docker",
}
}
forward_to = [loki.write.default.receiver]
}This automatically picks up containers as they start and stop — no Alloy restart required once it’s running. It reuses the same Docker socket mount as the container metrics collector above, so no additional volume mount is needed for this one.
Apply & Verify
All four collectors above need volume mounts added to your Alloy docker-compose.yml:
volumes:
  - /:/rootfs:ro
  - /sys:/sys:ro
  - /run/udev/data:/run/udev/data:ro
  - /var/run/docker.sock:/var/run/docker.sock:ro
- /var/log:/var/log:roRecreate the Alloy container to pick up both the new mounts and the new config files in one step:
docker compose up -d alloyOpen the Alloy web UI and confirm all four components are healthy:
prometheus.exporter.unix.unixprometheus.exporter.cadvisor.dockermetricsloki.source.file.authlog/loki.source.file.syslogloki.source.docker.containers
Then verify data is flowing in Grafana’s Explore view — metrics first:
node_cpu_seconds_total{job="unix"}container_cpu_usage_seconds_total{job="docker"}Then logs:
{job="syslog"}{job="docker"}Filter by container name for more targeted queries:
{job="docker", container="traefik"}Grafana Dashboards
You can create your own dashboards or use these as a starting point:
- System Dashboard — host metrics
- Docker Dashboard — container metrics