
Collecting metrics is only half the picture — you also need to know when something breaks, and you need your dashboards to survive a container rebuild. This post covers both: Grafana Alerting evaluates rules against your Prometheus data and fires notifications to a contact point of your choice, and dashboard provisioning loads dashboards from JSON files on disk so they’re never lost and always in version control.
Prerequisites
- Prometheus running with metrics flowing in
- Grafana running with Prometheus added as a datasource
- Setup from Building the Stack
How Grafana Alerting Works
Three components work together:
- Alert Rules — PromQL expressions evaluated on a schedule; fire when a condition is met
- Contact Points — where notifications are sent (Discord, webhook, email)
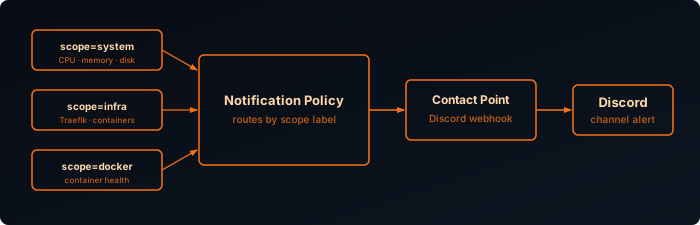
- Notification Policies — route alerts to the right contact point
All three can be provisioned from YAML files, keeping your alerting config in version control alongside the rest of your stack.
Directory Structure
Add an alerting/ folder inside your existing Grafana provisioning directory:
grafana/
└── provisioning/
    ├── datasources/
    ├── dashboards/
    └── alerting/
        ├── contact-points.yaml
        ├── policies.yaml
        ├── rules.yaml
└── templates.yamlContact Point
In your Discord server go to Settings → Integrations → Webhooks → New Webhook and copy the webhook URL.
Instead of sending Grafana’s default Discord payload, define a notification template so the message is easier to scan in chat:
apiVersion: 1
templates:
  - orgId: 1
    name: discord.message
    template: |
      {{ define "discord.message" }}
      {{ if eq .Status "resolved" }}✅ **Resolved**{{ else }}🔴 **Firing**{{ end }}
      {{ range .Alerts }}
      **{{ .Labels.alertname }}**
      {{ .Annotations.summary }}
      {{ if .Labels.name }}Container: `{{ .Labels.name }}`{{ else if .Labels.cn }}Certificate: `{{ .Labels.cn }}`{{ else if .Labels.instance }}Instance: `{{ .Labels.instance }}`{{ end }}{{ if .Labels.severity }} | Severity: {{ .Labels.severity }}{{ end }}
      {{ end }}
{{ end }}Then provision the Discord contact point and render that template into the message body:
apiVersion: 1
contactPoints:
  - orgId: 1
    name: Discord
    receivers:
      - uid: discord
        type: discord
        settings:
          url: "${DISCORD_WEBHOOK_URL}"
message: "{{ template \"discord.message\" . }}"Add the webhook URL to your Grafana container environment:
environment:
- DISCORD_WEBHOOK_URL=https://discord.com/api/webhooks/your-id/your-tokenNotification Policy
Route all alerts to Discord by default:
apiVersion: 1
policies:
  - orgId: 1
receiver: DiscordYou can also split alerts into categories such as system, infra, and docker. The useful part is not just the folder layout in Grafana, but the labels on each rule. Once a rule carries a label like scope: system, you can route or filter it however you like later.
apiVersion: 1
policies:
  - orgId: 1
    receiver: Discord
    routes:
      - receiver: Discord
        object_matchers:
          - ["scope", "=", "system"]
      - receiver: Discord
        object_matchers:
          - ["scope", "=", "infra"]
      - receiver: Discord
        object_matchers:
- ["scope", "=", "docker"]Notification Template
Grafana notification templates use Go templating syntax. In this example, the template does three things:
- Shows a different header for firing and resolved alerts
- Loops over
.Alertsso grouped notifications still include every alert - Pulls fields from labels and annotations, including the
summarywe define on each rule
That keeps the Discord message compact while still including the instance and severity at a glance.
Alert Rules
Structure
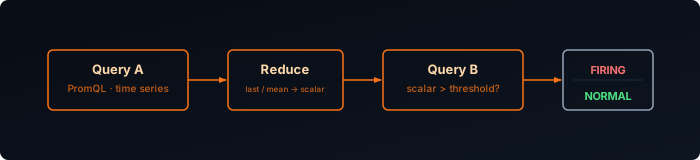
Each rule uses two query steps — a Prometheus query (refId A) and a threshold expression (refId B). Keeping the threshold separate from the PromQL prevents Grafana from treating an empty result (condition not met) as missing data and firing a false DatasourceNoData alert.
You do not need to keep everything in one alert group either. A common split is:
Systemsfor host-level CPU, memory, disk, temperature, and reboot alertsInfrastructurefor service availability and network-level checksDockerfor container restarts, unhealthy containers, or missing exporters
All rules across all three groups live together in a single alerting/rules.yaml file. Rather than reprint all eighteen rules — most of which just swap out the PromQL expression and threshold — here’s the full definition of one representative rule from each group, followed by a summary table of the rest.
Systems: CPU Usage High
apiVersion: 1
groups:
  - orgId: 1
    name: systems
    folder: Systems
    interval: 1m
    rules:
      - uid: cpu-high
        title: CPU Usage High
        condition: B
        data:
          - refId: A
            datasourceUid: prometheus
            relativeTimeRange:
              from: 300
              to: 0
            model:
              expr: 100 - (avg by(instance) (rate(node_cpu_seconds_total{mode="idle"}[2m])) * 100)
              instant: true
              refId: A
          - refId: B
            datasourceUid: "__expr__"
            model:
              type: threshold
              expression: "A"
              refId: B
              conditions:
                - evaluator:
                    params:
                      - 80
                    type: gt
                  operator:
                    type: and
                  query:
                    params:
                      - A
                  reducer:
                    type: last
        noDataState: OK
        execErrState: Error
        for: 5m
        labels:
          scope: system
          severity: warning
        annotations:
          __dashboardUid__: "ddmvax2tzuv40c"
          __panelId__: "5"
summary: "{{ $labels.instance }} CPU above 80% (current: {{ $values.A.Value | printf \"%.1f\" }}%)"The query (refId A) averages CPU utilization across all cores over a 2-minute window; the threshold step (refId B) compares that average against 80% separately, so a scrape gap doesn’t get misread as “no data = alert”. It only fires once CPU has stayed above 80% for a full 5 minutes (for: 5m), and the summary annotation reuses the evaluated value ($values.A.Value) so the Discord message shows the exact percentage that tripped it.
Infrastructure: Host Down
apiVersion: 1
groups:
  - orgId: 1
    name: infrastructure
    folder: Infrastructure
    interval: 1m
    rules:
      - uid: host-down
        title: Host Down
        condition: A
        data:
          - refId: A
            datasourceUid: prometheus
            relativeTimeRange:
              from: 300
              to: 0
            model:
              expr: up{job="unix"} == 0
              instant: true
              refId: A
        noDataState: Alerting
        execErrState: Alerting
        for: 2m
        labels:
          scope: infra
          severity: critical
        annotations:
          __dashboardUid__: "ddmvax2tzuv40c"
          __panelId__: "1"
summary: "{{ $labels.instance }} is unreachable"This one skips the two-step pattern — up{job="unix"} == 0 already evaluates to a clean boolean, so condition: A is enough on its own. The important difference from the threshold-style rules is noDataState: Alerting and execErrState: Alerting: for every other rule a missing scrape resolves to OK, but here a host that stops responding entirely looks exactly like “no data”, so both are flipped to Alerting to make sure a fully-dead host still pages you instead of going quiet.
Docker: Docker Container Down
apiVersion: 1
groups:
  - orgId: 1
    name: docker
    folder: Docker
    interval: 1m
    rules:
      - uid: docker-container-down
        title: Docker Container Down
        condition: B
        data:
          - refId: A
            datasourceUid: prometheus
            relativeTimeRange:
              from: 300
              to: 0
            model:
              expr: time() - container_last_seen{container_label_com_docker_compose_project!="", name!=""} > 60
              instant: true
              refId: A
          - refId: B
            datasourceUid: "__expr__"
            model:
              type: threshold
              expression: "A"
              refId: B
              conditions:
                - evaluator:
                    params:
                      - 0
                    type: gt
                  operator:
                    type: and
                  query:
                    params:
                      - A
                  reducer:
                    type: last
        noDataState: OK
        execErrState: Error
        for: 2m
        labels:
          scope: docker
          severity: critical
        annotations:
          __dashboardUid__: "docker-metrics"
          __panelId__: "200"
summary: "{{ $labels.name }} has not reported metrics for more than 60 seconds"This one uses container_last_seen rather than up{job="docker"}, because cAdvisor’s own scrape target stays up even when an individual container has stopped — only that container’s last-seen timestamp goes stale. The PromQL already contains the threshold (> 60), which evaluates to 1 once a container hasn’t reported in over 60 seconds; refId B just checks that this result is greater than 0, i.e. true. The label filters container_label_com_docker_compose_project!="" and name!="" exclude cAdvisor’s own internal/pause-container series that don’t carry a real container name.
The rest of the ruleset
The remaining rules follow the same two-step query/threshold pattern shown above, just with a different PromQL expression and threshold per check. The full YAML for all of them is in the project’s alerting config; here’s what each one does:
| Rule | What it checks | Threshold | Severity |
|---|---|---|---|
Memory Usage High (memory-high) | % of RAM in use | > 85% for 5m | warning |
Swap Usage High (swap-high) | % of swap in use | > 80% for 5m | warning |
Disk Space Low (disk-low) | % free space on the root filesystem | < 10% for 5m | warning |
High Load Average (load-high) | 15-minute load average, normalized per CPU core | > 1 per core for 10m | warning |
High Temperature (temp-high) | Highest hwmon sensor reading | > 85°C for 5m | warning |
System Reboot Detected (system-reboot) | Seconds since boot | < 300s uptime, fires immediately | warning |
Network Errors (network-errors) | Combined rx+tx error rate on physical interfaces | > 10 errors/s for 5m | warning |
Network Throughput High (network-high) | Combined rx+tx byte rate on physical interfaces | > 100 MB/s for 5m | warning |
Traefik Down (traefik-down) | Traefik metrics endpoint reachability | unreachable for 2m | critical |
Traefik 5xx Rate High (traefik-5xx-high) | Rate of HTTP 5xx responses served by Traefik | > 0.1 req/s for 5m | warning |
Traefik Response Time High (traefik-latency-high) | Average request duration across Traefik services | > 1s for 10m | warning |
Traefik Certificate Expiring Soon (traefik-cert-expiring) | Days remaining until TLS cert expiry | < 14 days | warning |
Docker Container Restart Loop (docker-container-restart-loop) | Number of container start-time changes in a 15m window | > 2 restarts / 15m | critical |
Docker Container CPU High (docker-container-cpu-high) | Per-container CPU usage rate | > 0.8 cores for 10m | warning |
Docker Container Memory High (docker-container-memory-high) | Per-container working set memory | > 1 GiB for 10m | warning |
Dashboard Linking
The __dashboardUid__ and __panelId__ annotations link each rule to a specific panel. When an alert fires, Grafana adds a red annotation line directly on the chart and a Go to dashboard button appears in the alert detail view, making it easy to jump straight to the relevant graph.
Replace ddmvax2tzuv40c with your own dashboard UID, found at the bottom of the dashboard JSON or in the dashboard URL.
Apply Configuration
Restart Grafana to load the provisioned files:
docker restart grafanaVerification
Open Grafana → Alerting → Alert rules and confirm the rules appear under the expected folders such as Systems, Infrastructure, or Docker, with state Normal.
To trigger a test notification, open Alerting → Contact points, find Discord, and click Test.
To verify the CPU alert end-to-end, stress all cores for long enough to survive the 5-minute pending window:
stress-ng --cpu $(nproc) --timeout 360sDashboards as Code
Dashboards created through the Grafana UI are stored in its SQLite database inside the grafana_data volume. The volume survives container rebuilds, but it is not in version control — there is no history, no way to diff changes, and no easy path to reproducing the same setup on another machine. Provisioning solves this by loading dashboards from JSON files on disk at startup, keeping them alongside the rest of your stack config in git.
How Dashboard Provisioning Works
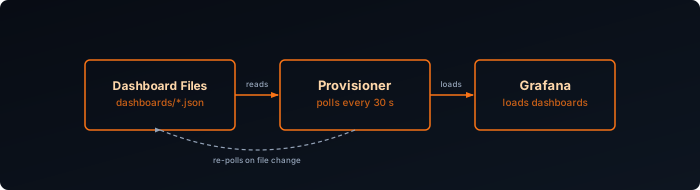
Grafana’s provisioning system reads a configuration file at startup that points to one or more directories. Any .json file it finds there is loaded as a dashboard and placed in the specified folder. If the file changes on disk, Grafana picks up the update within the configured interval — no restart required.
Directory Structure
Add a dashboards/ directory inside your existing provisioning folder:
grafana/
└── provisioning/
    ├── datasources/
    ├── alerting/
    └── dashboards/
        ├── dashboards.yaml
        ├── systems/
        │   └── system-metrics.json
        ├── docker/
        │   └── docker-metrics.json
        └── infrastructure/
└── traefik-proxy.jsonEach subdirectory maps to a folder in the Grafana UI. You can add as many folders and JSON files as you like.
Provisioner Config
Create the provider configuration file:
apiVersion: 1

providers:
  - name: "systems"
    orgId: 1
    folder: "Systems"
    type: file
    disableDeletion: false
    updateIntervalSeconds: 30
    allowUiUpdates: true
    options:
      path: /etc/grafana/provisioning/dashboards/systems

  - name: "infrastructure"
    orgId: 1
    folder: "Infrastructure"
    type: file
    disableDeletion: false
    updateIntervalSeconds: 30
    allowUiUpdates: true
    options:
      path: /etc/grafana/provisioning/dashboards/infrastructure

  - name: "docker"
    orgId: 1
    folder: "Docker"
    type: file
    disableDeletion: false
    updateIntervalSeconds: 30
    allowUiUpdates: true
    options:
path: /etc/grafana/provisioning/dashboards/dockerA few settings worth noting:
updateIntervalSeconds: 30— Grafana polls the directory every 30 seconds and reloads any changed JSON files. This means you can update a dashboard file and see the change in the UI without restarting the container.allowUiUpdates: true— You can still edit the dashboard in the Grafana UI. Changes made through the UI are written back to the JSON file on disk. Without this, any UI edits are discarded on the next reload.disableDeletion: false— If you delete a JSON file, Grafana removes the dashboard from the UI on the next poll.
Volume Mount
The provisioning directory needs to be mounted into the Grafana container. Add the volume mount to your docker-compose.yml:
volumes:
  - grafana_data:/var/lib/grafana
- ./provisioning:/etc/grafana/provisioningThe entire provisioning/ directory is mounted at once, so datasources, alerting rules, and dashboards all load from the same mount.
Exporting Dashboards from the UI
To get a dashboard’s JSON from an existing Grafana instance:
- Open the dashboard
- Click the Share icon (top toolbar) → Export
- Enable Export for sharing externally to replace internal datasource UIDs with variable names
- Click Save to file
Save the downloaded file into the appropriate subdirectory under provisioning/dashboards/. Grafana will pick it up within 30 seconds.
Apply Configuration
Restart Grafana to load the provisioner config for the first time:
docker restart grafanaAfter that, any new or updated JSON files in the dashboard directories are picked up automatically within 30 seconds.
Verification
Open Grafana → Dashboards and confirm the folders appear: Systems, Infrastructure, and Docker. Each folder should contain the dashboards from the corresponding JSON files.
To confirm provisioning is working correctly, check the Grafana logs:
docker logs grafana | grep -i provisionYou should see lines like:
provisioning.dashboard: Provisioned dashboard from file ...If a JSON file has a syntax error, Grafana logs the error and skips that file without affecting the others.